MV Telemetry – Part 4 Engines
WTF John Deere?
In 2018 my wife and I were crossing the Florida’s lake Okeechobee heading east. We had just started out for the morning and were passing through the narrow winding channel to get into the lake proper when one of our John Deere engines alarmed throwing a high temperature alert.
The Scooby team jumped into action. Shutting down one engine immediately we proceed to navigate the channels to a safe spot on a single engine. When we got to an area in the channel large enough for my wife to hold position I diagnosed that we had trashed an impeller due to insufficient water flow and hence an angry engine. I replaced that impeller, including flushing the parts out of the heat exchanger, in record time and we were back under way.
That is the event that got me thinking about needing telemetry on our boat. I thought to myself why did the JD engine alarm at 225F. If the engine had alarmed at an earlier temperature maybe things would have gone differently. Hence my desire to tap into the data in our engines and take control of our monitoring.
How to be the Engine Whisperer
On Adventuress we have two John Deere 4045TFM75 engines. Modern diesel engines now days all use computers to control and coordinate all of the components — like timing, emissions, rpm, etc. The language the engine uses to communicate is called SAE J1939. So our John Deere engines use J1939 to communicate with the engine displays at both helm stations. So all the data I might ever want is on the J1939 bus but, how to get connected into that bus AND get it onto my NMEA2000 network? Lets break this down into two steps.
First we need a gateway for J1939 to N2K. I decided to use a Maretron J2K100 bridge. It is a very simple black box that takes in J1939 and then sends out N2K PGNs. Maretron’s device is such that it is one black box/gateway per engine. Maretron has pretty darn good technical support and even a tech page on connecting to JD engines. For wiring the J1939 side; two options exist to connect to the engine. The first is a y-cable like in the Maretron page linked above and the other is to use a diagnostic port on the engine itself. It took some serious sleuthing but, with the help of online forums and digging through my John Deere parts manual I identified the likely connector as seen here. Now my JD engines use a Deutsch assembly connector which I had not used before. Needless to say they are awesome if you have a large number of wires to connect and want it water proof. I ordered up parts from wirecare.com and then went through the fun process of mapping the wires out. It went JD Engine -> 9 pin -> Maretron Connector. On the engine diagnostic connector I had these wires mapped out. I wanted pins “C” and “D”. I found that the wire colors referenced in Maretron’s tech article to be reversed to what was in my wire harness. See Figure 1.
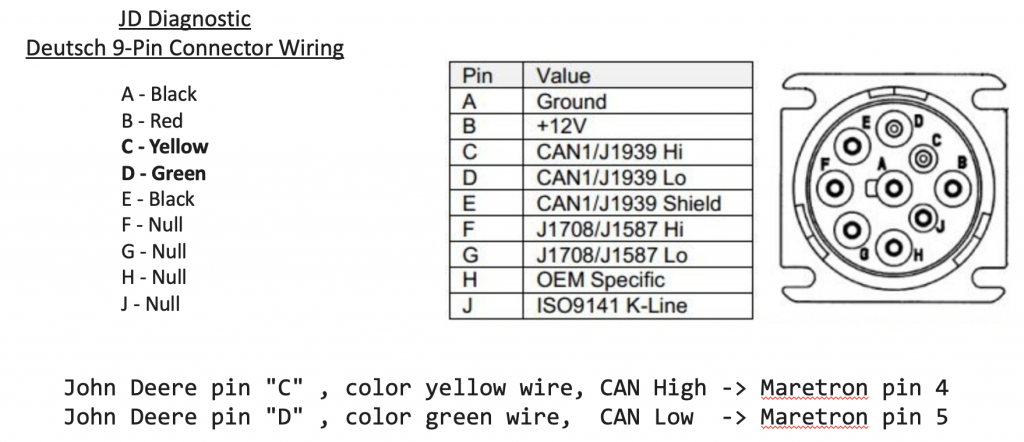
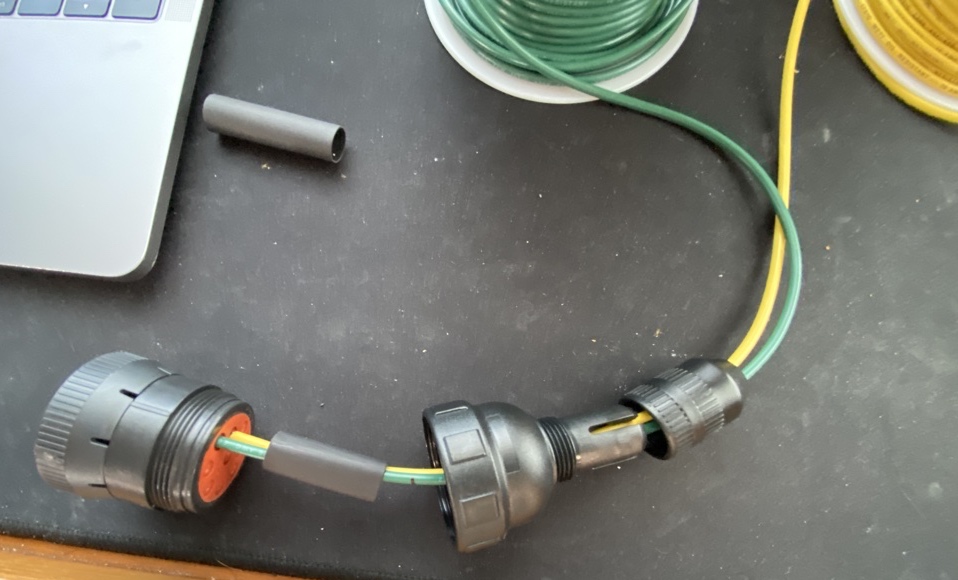
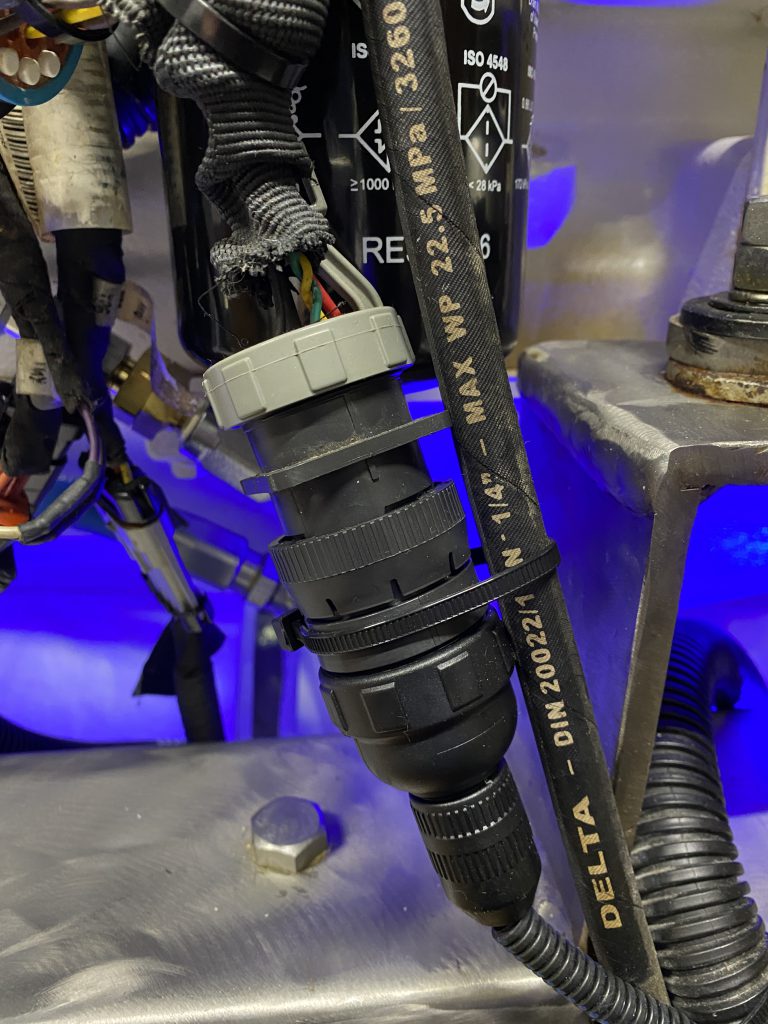
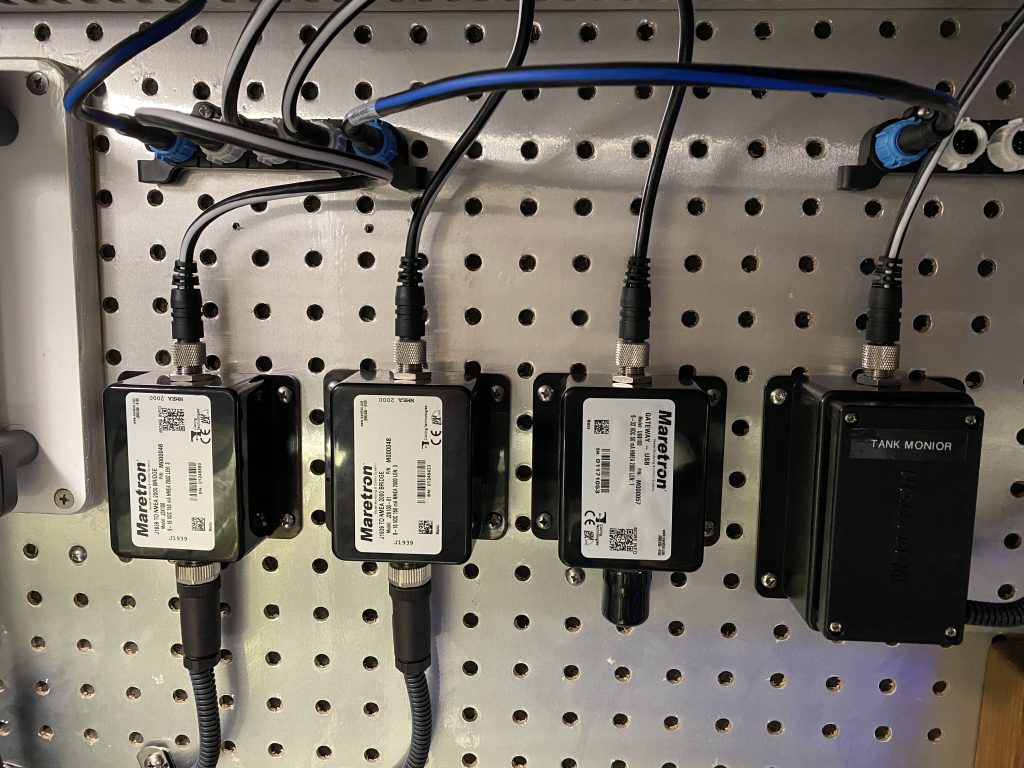
Once I got the wiring figured out and the connectors built (Figure 2) I got everything plugged in (Figure 3). For two engines the only configuration that was needed was to set the engine instances. Zero for port and one for starboard so that the engine data can be unique on the NMEA PGNs. For Maretron you need a Maretron J2K100 NMEA/USB (Figure 4) gateway to program your devices. Using PC software it was pretty simple and the software + gateway is a good diagnostic / troubleshooting tool. Now that the instances are configured I started to receive engine data on the NMEA 2k bus and into SignalK.
Time to Grafana the shit out of your data!
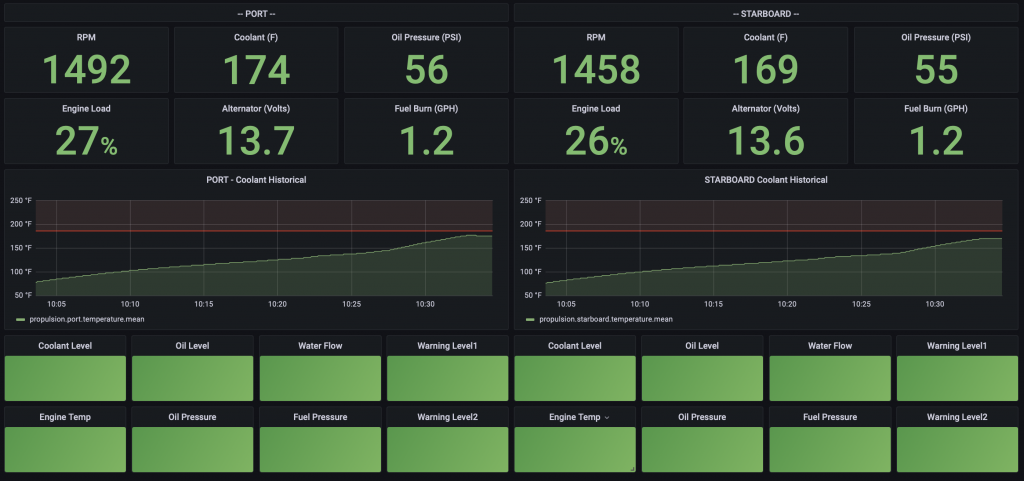
So having the data in SignalK was all good and fine but, I really needed it in a dashboard format so I could view what was important to me while we were underway. To start, there are two types of data my bad boy engines are spewing out. First, the obvious is which is all the typical numerical data that you are used to seeing; rpm, oil pressure, coolant temperature, etc. The second, you may not be aware of is metric fuck ton of system status messages. I will cover both data sets and how I massaged the AF out of everything. You can download my Grafana dashboard on my public GitHub page here.
So raw engine metrics at this point should be stuffed into your dB of choice (InfluxdB) and then hoovered up into Grafana. Now for numeric engine data you need to setup all your queries in Grafana to take the last value. If not you won’t be seeing near real time values. Next for each metric panel such as “coolant temperature” I would go back through my engine logs and determine alarm thresholds. As an example for engine coolant until the engines hit 160F the stat panel color is blue (cold) and above 180F they go to yellow and at 185F the color goes to red. I know that at WOT my engine even in summer should not hit 185. Obviously every boat is different. For near real time metrics the dashboard refreshs every 5 seconds. For coolant I wanted to see temperature over time so I have a chart showing one hour of data. In startup I watch this graph closely as I expect to see a nice smooth curve as the engines heat up. To get the coolant graph to look like i wanted I had to go in and use the older deprecated Graph(old) panel. Works great though.
The second set of data which is all of the notifications needed some extra work. The J1939 status notice message has payload data in text. For example the message “notifications.propulsion.state.port.lowOilLevel” has a payload value of {“normal”, “alert”, “warn”, “alarm”, “emergency”}. That’s all great and fine but, Grafana does not do well with text data. I needed to convert this to a numeric value. There are a number of ways this could be done but, the simplest for my set of skills was to run a node-red flow that would transform this data {“normal”, “alert”, “warn”, “alarm”, “emergency”} to this {1, 2, 3, 4}. You can find the node-red flow on my Git repo here. Now in Grafana it is a simple task to change a stat box panel color based on the threshold values 1, 2, 3, 4. Notice I did not say SingleStat panel but, the Stat panel.
Wrapping it all up
My wife and I have been boating now over a decade and have a decent amount of both coastal and offshore experience. The reason I bring this up is with that experience I consider our engine dashboard a key safety device for our boat. We do not leave the dock unless it’s up and running. With our dashboard I let the data and thresholds do all the heavy lifting. When underway in 1 second I can glance at the dashboard and see if our John Deere’s are purring along and happy or if something is up. If the board is green we are good to go.
What’s next? In my next blog I will post how I will use a Yacht Device Alarm Button to add audible alarms tied to any alarm threshold on my engine data.
2 thoughts on “MV Telemetry – Part 4 Engines”
How are you getting the engine data from signalk into node-red and then back into signalk/grafana?
I have signalk and grafana all up and running and node-red is running as well but I can’t figure out how to use node-red to change the “normal” and get it sent back.
Node Red runs as a application within SignalK. It has nodes available to subscribe to SignalK data and send it back out to either SignalK or to InfluxdB. Grafana pulls data only from Influxdb.