How the simple things are hard: Tide data
One of the most useful Grafana panels we have done to date is our tide table. As I have been building up my skills on SignalK and Grafana in general one of the items that has been on our punch list for a while was to display the daily tides from NOAA based on our location. It seems simple at first given there was a plugin in SignalK for pulling NOAA tides. However, the project ended up stretching out for several weeks as I ran into one obstacle after another.
The first issue I ran into was that the SignalK tide plugin did not work correctly. It would go out and pull the local tide data from NOAA but, for whatever reason it would not populate the key:value data into SignalK data browser. I could hit the data with an API call into SignalK directly but, the data path was not populated. Java Script not being in my wheel house to troubleshoot, I decided to embark on using Python which is code I do know. I already had some code I had written over a year ago to pull data from NOAA to get humidity and barometer readings so I felt it was something I could pull off.
So, knowing that my existing sets of various python code for SignalK, NOAA, and Influx were all pretty hack code, I decided to start over and write code modules for each platform with proper error handling. I started by reviewing the code on the tide plugin here. That helped me determine how to identify the nearest NOAA station based off my boats current GPS locations (which always is available). I make a quick API call into SignalK and grab the current GPS coordinates. The next step could have went to ways. The way I implemented was to have a list of all NOAA stations in WA state with lat/lon coordinates. The program would import that data and run through the list to determine the closest station ID. Later I found out NOAA has an API to determine the closest station. Oh well! Once I have the NOAA station ID then I call into the NOAA API resource and pull the tide data. The NOAA website for tide and currents is quite good and can be found here.
This is where the second hurdle I ran into comes along. Influx is a time series database and as such it stores data by timestamp. Influx is really not designed to function more like a relational database. However, I really resisted having more then one db running on our server. So the conundrum comes up how do you display data in Grafana for today’s tide when the data may change if we move our boat during the day AND the number of tides in a day is not static? On top of that I need to get timestamps for whatever data I write into the database to be in UTC time and for the current day. So I utilized some tricks to make this work.
The first trick was to only write one set of data per day into the database measurement. If the program got new data later in the day because our boat moved to a new location and the NOAA station changed, it would overwrite the original set of data instead of appending to the database. The second was to use a tag field <date> that I would write the day of the tide too. The tide_time field is the actual time from NOAA in local time written as a string value. Hence no UTC concerns there.
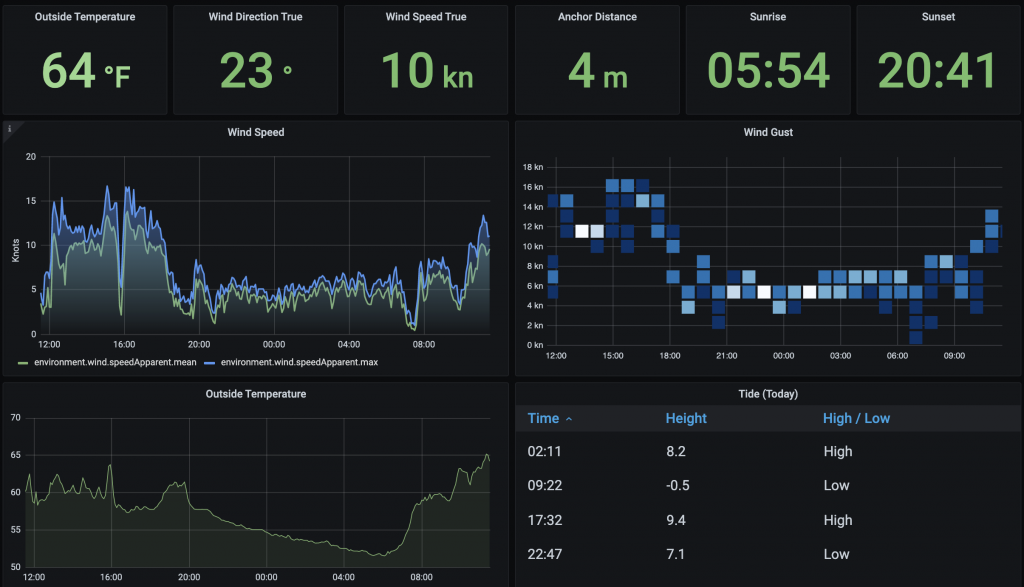
The second trick to overwrite the days data if needed was to construct my own timestamps for the write point operation. One I determined the UTC date needed I would linearly write out my data with a timestamp that always start at 12:01 AM UTC time and increment 1 minute for each record. That way if I got new data I would overwrite with the exact same timestamp and maintain only one set of tide data per day. See query results below of four records for the day even though the data is updated hourly.
> SELECT “tide_time”, “height”, “type” FROM “tide” WHERE (“date” = ‘2021-08-05’) AND time >= now() – 24h
name: tide time
tide_time height type
———————— ——– ———
1628146860000000000 02:11 2.51 H
1628146920000000000 09:22 -0.159 L
1628146980000000000 17:32 2.879 H
1628147040000000000 22:47 2.176 L
So phew! Now I have the data and it should be a piece of cake now in the Grafana panel. Nope. The query listed above works great if I insert the date string manually but, I need Grafana to do that for me. So in the query field you have insert the match statement to be date= ${__to:date:YYYY-MM-DD} . The code in italics inserts the current date matching the field syntax stored in InfluxDb. Next the default table in Grafana 7.5 kind of sucks. The newer table panel has no option to adjust font size which made it pretty unusable. I found that you can add the table panel and then have it revert to the old table panel style and get control of fonts back. Open your panel’s JSON and then find the line reading: "type": "table", Change the line to: "type": "table-old". Now you can adjust the font size in the panel based on percentage.
In conclusion I had two major parts to getting tide data into Grafana. First was the actual gathering and manipulating the data in such a way in python so that Grafana could query it correctly. The second was getting the Grafana panel itself into viable option. I hope this helps and if you want to see some of the source content check out my public GitHub account https://github.com/scurvy-dog/Adventuress-Public